GOLD:
Uptrend Intact - Breakout Successful!
There seems to be a lot of complaining and hand-wringing among gold and precious metals investors. Why? The future for precious metals actually looks very bright.
The reason is: We’re spoiled by now, and we still don’t fully understand the profound nature of this hyper-secular bull market.
Yes, the losses in 2006 were severe, and we haven’t totally recovered from them yet - but so what? What’s wrong with a temporary market pull-back?
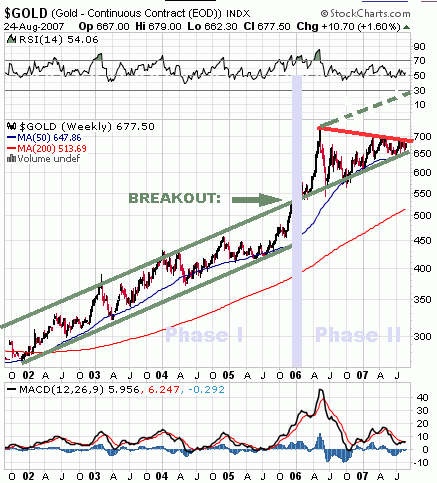
Granted, this one has taken over a year - but again: So what? If I look at the really long-term chart, the one that goes back six years, I see the following:
Phase I: A secular bull begins;
Phase II: A tremendously successful breakout from Phase I with a new uptrend one step up from Phase I;
Phase III: Not here yet. Hard to predict. It could be very close, but it could also last as long as Phase I. My personal take: It’s closer than we may think.
Here is the chart:

From the beginning of the bull until December of 2006, Phase I showed a nice, steady uptrend. In December that year, the uptrend was ratcheted up one notch, and our gold bull entered Phase II.
Note that, despite the late-springtime 2006 carnage of the dollar/gold ratio, the chart has bravely remained entirely above the upper trend line established in Phase I. The fact that a powerful pennant pattern has evolved shouldn’t concern anyone, really - unless you are a trader, of course. If you have missed the top in April of 2006, you've been bled, and you’re probably still hurting.
The Monitor no longer exists. I have discontinued it in June-July of 2006 to be able to focus on my day job that became very demanding at that time. But if you have followed the Monitor’s standing advice and stuck to buying metal, you haven’t lost anything during this time - and you won’t start losing now.
Except for a short two month period (September/October) in 2006 and for a couple of weeks in January of ‘07, the gold chart has remained entirely above its 200 day moving average. That alone should give any complainers pause. But there is more to this incredibly positive outlook:
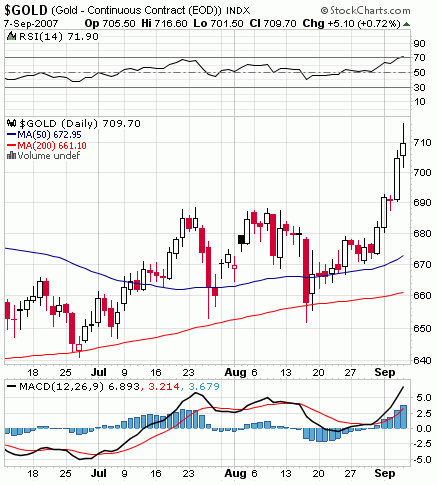
Look at this three-month daily chart:

Every single time you see a long descending red bar, at most two of them back to back, you can see the chart trying to climb back up right away - until the next long downward bar shows up.
That is not a normal development. It is an indication that the market really wants to rise - and that it simply isn’t allowed to rise. However, that pressure under the gold price didn't just go away because of this price suppression. If anything, it has increased.
The fundamental picture backs this up:
What’s been happening is the unwinding of the housing market. All that money needed a place to go - but the banking cartel couldn’t afford to allow it to go into precious metals.
While in prior years (since 2003) gold rose right alongside the Dow, during the last year and a half or so gold was put on hold so the Dow and US treasuries could absorb the paper credits (dollars) that no longer went into housing. That way, the long term (mortgage) interest rates stayed nice and low (as the longer term treasuries went up in price from the demand, the yields stayed low) which eased downward pressure on the housing market, while other parts of the dollar world were funneled into the Dow.
As I wrote years ago: Once you see gold rising for an extended period while the Dow is falling, it’s all over. When that happens, you will know that the fiat cartels will have lost all clout. They are trying everything - and I mean everything they can - to keep gold in check, especially now while the Dow looks a bit shaky.
But things are coming to a nice point right now. That point is the apex of the over one year-long pennant formation. We are very close to the breakout point.
Expect a few hair-raising down days for the PMs when the Dow adds an “n” to its name and seriously starts heading south - but the down days for PMs won’t last.
Fundamentally, there is absolutely no reason at all why gold should discontinue its historic uptrend now. Even if the breakout from this giant pennant pattern is to the downside at first, not to worry. It has happened before. As usual, it happened to widespread chorus of moaning, hand-wringing and gnashing of teeth, but it didn’t last, and it won’t last now, either.
The question is whether the chart will go into overdrive and enter phase three (shoot above and remain above the dotted upper trend line of phase II) or whether it will stay in Phase II for a while.
The chattering chorus of gnashing teeth will soon shift from the PM world into the paper world. If you own gold and silver and a good handful of hard cold paper cash (it’s relatively rare, so it will keep its value even in a financial catastrophe), you should be okay.
The most interesting question of all is this: What will happen to the price of gold when Ron Paul gets elected? Do you think I'm a dreamer?
Stay tuned.
Alex Wallenwein
Editor, Publisher
The EURO VS DOLLAR MONITOR
Just like driving your car, investing only makes sense if you can see where you are going. The Euro vs Dollar Monitor is your golden windshield wiper that removes the media's crud of financial misinformation from your investment outlook. Don't drive (your investment vehicle) without it!
August 24, 2007